
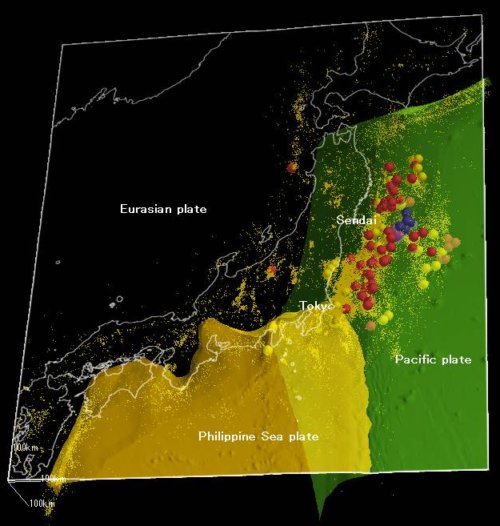
3D model of 2011 Tohoku earthquake’s hypocenter disposition.
Earthquakes over magnitude 6.0 are showed by spheres. You can see positional relation between hypocenters and plates, time course of earthquakes.
Description
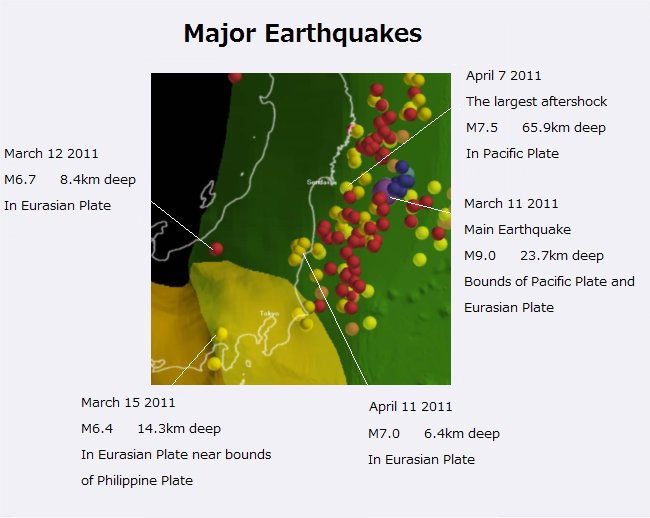
2011 Tohoku earthquake and tsunami, marked magnitude 9.0, occurred on March 11 at the depth of 23.7 km offshore Miyagi prefecture. The point is bounds of Pacific Plate and Eurasian plate.
After the main earthquake, 66 earthquakes over magnitude 6.0 occurred nearby the epicenter until March 13.
From March 14 to end of August, 51 earthquakes over magnitude 6.0 occurred mainly around outer edge of the epicenter.
You can see that spread of hypocenters stops where Pacific Plate is sinking under Philippine Sea plate.
Additionally, 8 earthquakes over magnitude 6.0 occurred on March 9 and 10 just before the main earthquake at the northeast of the epicenter.
Download
Added Hypocenters over Magnitude 1.0 Ver.:
TohokuEarthquake2E.zip Added M1+
(Please unzip these files)
- Needs freeware Molcer over ver.1.27.
- If you use this data, show source as “https://white-rabbit.jp/contents/TectonicPlatesAroundJapan/indexE.html” and link to this page.

Screen shot.
Green:Surface of Pacific Plate
Orange:Surface of Philippine Sea plate
Earthquakes over magnitude 6.0
Purple:Main Earthquake on March 11
Blue:Earthquakes from March 9 to 10
Red:Earthquakes from March 11 to 13
Yellow:Earthquakes from March 14 to August 31
Movie.
Also available for scaling, viewing section by arbitrary clipping plane, and so on.
Screen shot (added over magnitude 1.0 ver).
Green:Surface of Pacific Plate
Orange:Surface of Philippine Sea plateSphere:Earthquakes over magnitude 6.0
Purple:Main earthquake on March 11
Blue:Earthquakes from March 9 to 10
Red:Earthquakes from March 11 to 13
Yellow:Earthquakes from March 14 to August 31Point:Earthquakes from March 9 to August 31 over magnitude 1.0
Movie (added over magnitude 1.0 ver).
Also available for scaling, viewing section by arbitrary clipping plane, and so on.
References
Referred following papers or documents.
- Plate Figure
Kita, S., T. Okada, A. Hasegawa, J. Nakajima, and T. Matsuzawa (2010), Anomalous deepening of a seismic belt in the upper-plane of the double seismic zone in the Pacific slab beneath the Hokkaido corner: Possible evidence for thermal shielding caused by subducted forearc crust materials, Earth Planet. Science Lett., 290, 415-426.
J. Nakajima and A. Hasegawa (2006), Anomalous low-velocity zone and linear alignment of seismicity along it in the subducted Pacific slab beneath Kanto, Japan: Reactivation of subducted fracture zone?, Geophys. Res. Lett., 33, L16309, doi: 10.1029/2006GL026773.
J. Nakajima, F. Hirose, and A. Hasegawa (2009), Seismotectonics beneath the Tokyo metropolitan area, Japan: Effect of slab-slab contact and overlap on seismicity, J. Geophys. Res., 114, B08309, doi:10.1029/2008JB006101
F. Hirose, J. Nakajima, and A. Hasegawa (2008), Three-dimensional seismic velocity structure and configuration of the Philippine Sea slab in southwestern Japan estimated by double-difference tomography, J. Geophys. Res., 113, B09315, doi:10.1029/2007JB005274.
Hirose F, Nakajima J, Hasegawa A (2007) Three-dimensional velocity structure and configuration of the Philippine Sea slab beneath Southwestern Japan, estimated by double-difference tomography. Zisin Ser 2(60):1–20 (in Japanese with English abstract)
Hirose F, Nakajima J, Hasegawa A (2008) Three-dimensional velocity structure and configuration of the Philippine Sea slab beneath Kanto District, Central Japan, estimated by double-difference tomography. Zisin Ser 2(60):123–138 (in Japanese with English abstract)
J. Nakajima and A. Hasegawa (2007), Subduction of the Philippine Sea plate beneath southwestern Japan: Slab geometry and its relationship to arc magmatism, J. Geophys. Res., 112, B08306, doi:10.1029/2006JB004770.
Baba, T., Y. Tanioka, P. R. Cummins, and K. Uhira (2002), The slip distribution of the 1946 Nankai earthquake estimated from tsunami inversion using a new plate model, Phys. Earth Planet. Inter., 132, 59-73.
Uchida, N., T. Matsuzawa, J. Nakajima, and A. Hasegawa (2010), Subduction of a wedge-shaped Philippine Sea plate beneath Kanto, central Japan, estimated from converted waves and small repeating earthquakes, J. Geophys. Res., 115, B07309, doi:10.1029/2009JB006962. - Attitude / Water depth
Becker, J. J., D. T. Sandwell, W. H. F. Smith, J. Braud, B. Binder, J. Depner, D. Fabre, J. Factor, S. Ingalls, S-H. Kim, R. Ladner, K. Marks, S. Nelson, A. Pharaoh, R. Trimmer, J. Von Rosenberg, G. Wallace, P. Weatherall. (2009), Global Bathymetry and Elevation Data at 30 Arc Seconds Resolution: SRTM30_PLUS, Marine Geodesy, 32:4, 355-371.
Sandwell, D. T., and W. H. F. Smith (2009), Global marine gravity from retracked Geosat and ERS-1 altimetry: Ridge Segmentation versus spreading rate, J. Geophys. Res., 114, B01411, doi:10.1029/2008JB006008. - Hypocenter
The JMA unified hypocenter catalog is based on seismic data provided by the National Research Institute for Earth Science and Disaster Resilience, the Japan Meteorological Agency, Hokkaido University, Hirosaki University, Tohoku University, the University of Tokyo, Nagoya University, Kyoto University, Kochi University, Kyushu University, Kagoshima University, the National Institute of Advanced Industrial Science and Technology, the Geographical Survey Institute, Tokyo Metropolis, Shizuoka Prefecture, Hot Springs Research Institute of Kanagawa Prefecture, Yokohama City, and Japan Agency for Marine-Earth Science and Technology.
About Magnitude Value
Adopted most large value if multiple values are listed on the JMA unified hypocenter catalog.
Update history
April 24 2017 Separated from Japanese version.
April 26 2016 Replaced by light version.
November 22 2011 Revised.
November 20 2011 Revised drastically.
November 03 2011 Released.
Molcer Plus--3D image visualization and processing software
Reconstruct 3D models from sectional image sequences produced by X-ray CT or MRI. Easy to see surface / section / internal structure of data. It also implements ultrafast arithmetic operation by GPGPU.
Various measuring / analyzing methods are available. As well as processing / trimming / filtering / polygon reduction. Useful for 3D printing.